3d.js(v5)を使ったグラフに凡例を表示する方法についてご紹介します。
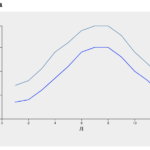
ここではNYの最高気温と最低気温のデータを例に、凡例を表示してみます。
目次
HTML/JavaScriptサンプル
<!DOCTYPE html>
<html>
<head>
<meta charset="utf-8">
<style>

h1{
  font-size: small;
  font-family: "Hiragino Kaku Gothic ProN","メイリオ", sans-serif;
}

svg{
  font: 10px sans-serif;
  background-color: #eee;
  text-align: right;
  padding: 3px;
  margin: 1px;
  color: #333;
}
</style>
<script src="d3.min.js"></script>
</head>
<body>
<h1>NYの平均気温</h1>
<script>

// データのセット 最高気温
var tempHigh = [
    [1, 4],
    [2, 6],
    [3, 11],
    [4, 18],
    [5, 22],
    [6, 27],
    [7, 29],
    [8, 29],
    [9, 25],
    [10, 18],
    [11, 13],
    [12, 7],
];

// データのセット 最低気温
var tempLowest = [
    [1, -3],
    [2, -2],
    [3, 2],
    [4, 7],
    [5, 12],
    [6, 18],
    [7, 20],
    [8, 20],
    [9, 16],
    [10, 10],
    [11, 6],
    [12, 0],
];

var width = 600; // グラフの横幅
var height = 400; // グラフの縦幅
var margin = { "top": 40, "bottom": 80, "right": 40, "left": 80 };

// SVGの設定
var svg = d3.select("body").append("svg").attr("width", width).attr("height", height);

// x,y軸スケールの設定
var xScale = d3.scaleLinear()
.domain([0, d3.max(tempHigh, function(d) { return d[0]; })])
.range([margin.left, width - margin.right]);

var yScale = d3.scaleLinear()
.domain([-10, d3.max(tempHigh, function(d) { return d[1]; })])
.range([height - margin.bottom, margin.top]);

// 軸の表示
var axisx = d3.axisBottom(xScale).ticks(5);
var axisy = d3.axisLeft(yScale).ticks(5);

svg.append("g")
  .attr("transform", "translate(" + 0 + "," + (height - margin.bottom) + ")")
  .call(axisx)
  .append("text")
  .attr("fill", "black")
  .attr("x", (width - margin.left - margin.right) / 2 + margin.left)
  .attr("y", 35)
  .attr("text-anchor", "middle")
  .attr("font-size", "10pt")
  .attr("font-weight", "middle")
  .text("月");

svg.append("g")
  .attr("transform", "translate(" + margin.left + "," + 0 + ")")
  .call(axisy)
  .append("text")
  .attr("fill", "black")
  .attr("text-anchor", "middle")
  .attr("x", -(height - margin.top - margin.bottom) / 2 - margin.top)
  .attr("y", -35)
  .attr("transform", "rotate(-90)")
  .attr("font-weight", "middle")
  .attr("font-size", "10pt")
  .text("最高気温");

// ラインの表示
svg.append("path")
  .datum(tempHigh)
  .attr("fill", "none")
  .attr("stroke", "steelblue")
  .attr("stroke-width", 1.5)
  .attr("d", d3.line()
    .x(function(d) { return xScale(d[0]); })
    .y(function(d) { return yScale(d[1]); }));

svg.append("path")
  .datum(tempLowest)
  .attr("fill", "none")
  .attr("stroke", "blue")
  .attr("stroke-width", 1.5)
  .attr("d", d3.line()
  .x(function(d) { return xScale(d[0]); })
  .y(function(d) { return yScale(d[1]); }));

// 凡例表示
svg.append('text')
  .attr("x", 500)
  .attr("y", 30)
  .text("最高気温")

svg.append("line")
  .attr("x1",550)
  .attr("x2",560)
  .attr("y1",27)
  .attr("y2",27)
  .attr("stroke-width",2)
  .attr("stroke","steelblue");

svg.append('text')
  .attr("x", 500)
  .attr("y", 50)
  .text("最低気温")

svg.append("line")
  .attr("x1",550)
  .attr("x2",560)
  .attr("y1",47)
  .attr("y2",47)
  .attr("stroke-width",2)
  .attr("stroke","blue");

</script>
</body>
</html>
凡例を表示するソース
最高気温と最低気温のラベルと、ラインチャートの色をSVGに追加します。
// 凡例表示

// 最高気温のテキストの表示
svg.append('text') // テキストタグの追加
  .attr("x", 500)  // X座標
  .attr("y", 30)   // y座標
  .text("最高気温")  // 表示するテキストの内容

svg.append("line") // ラインの追加
  .attr("x1",550)  // x軸の開始座標
  .attr("x2",560)  // x軸の終了座標
  .attr("y1",27)  // y軸の開始座標
  .attr("y2",27)   // y軸の終了座標
  .attr("stroke-width",2) // ラインの幅
  .attr("stroke","steelblue"); // 色の幅

// 最低気温のテキストの表示
svg.append('text')
  .attr("x", 500)
  .attr("y", 50)
  .text("最低気温")

svg.append("line")
  .attr("x1",550)
  .attr("x2",560)
  .attr("y1",47)
  .attr("y2",47)
  .attr("stroke-width",2)
  .attr("stroke","blue");
まとめ
凡例のテキストとラインをSVG追加して表示する方法でした。
最初なので文法を理解するためにひとつずつ追加してみましたが、カラーパレットやラベルなども配列でまとめて管理するなど効率的なソースにしたいです。
関連情報
リンク
リンク
リンク