d3.js(v5)で表tableを出力する方法のご紹介です。
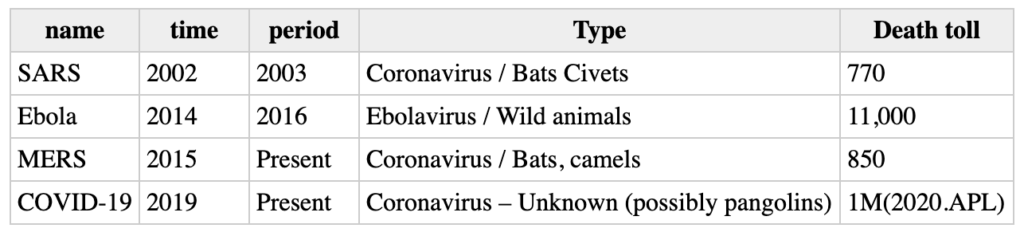
今回は、コロナウイルスと急性呼吸器症候群(COVID-19、MERS、SARS)と、エボラウイルスによるエボラ出血熱を比較する表を作成します。
目次
サンプルソース
<!DOCTYPE html>
<html>
<head>
<meta charset="utf-8">
<style>

svg{
  font: 10px sans-serif;
  background-color: #eee;
  text-align: right;
  padding: 3px;
  margin: 1px;
  color: #333;
}

th,td {
    border: solid 1px;          /* 枠線指定 */
    border-color: #ccc;
    padding: 4px;
}

table {
    border-collapse:  collapse; /* セルの線を重ねる */
}

th {
    text-align: center;           /* 文字の揃え位置指定 */
    background: #eee;
}

td {
    text-align:  left;        /* 文字の揃え位置指定 */
    min-width: 60px;
}

</style>
<script src="d3.min.js"></script>
</head>
<body>
<script>

var dataset = [
  { "name": "SARS", "time": 2002, "period": 2003, "Type": "Coronavirus / Bats Civets", "Death toll": "770"},
  { "name": "Ebola", "time": 2014, "period": 2016, "Type": "Ebolavirus / Wild animals", "Death toll": "11,000"},
  { "name": "MERS", "time": 2015, "period": "Present", "Type": "Coronavirus / Bats, camels", "Death toll": "850"},
  { "name": "COVID-19", "time": 2019, "period": "Present", "Type": "Coronavirus – Unknown (possibly pangolins)", "Death toll": "1M(2020.APL)"},
]

//keys() オブジェクトのキーを配列取得
var names = d3.keys(dataset[0]);

var table = d3.select("body")
  .append("table")
  .attr("border", "1")

table.append("thead")
  .append("tr")
  .selectAll("th")
  .data(names)
  .enter()
  .append("th")
  .text(function(d) { return d; });

table.append("tbody")
  .selectAll("tr")
  .data(dataset)
  .enter()
  .append("tr")
  .selectAll("td")
  .data(function(row) { return d3.entries(row); }) // d3.entries オブジェクトのキーと値を配列取得
  .enter()
  .append("td")
  .text(function(d) { return d.value; }); //d.value 値の参照

</script>
</body>
</html>
オブジェクト型データの準備
下記のように、オブジェクト型(JSON)のデータを用意します。
// name: 感染症の名前
// time: 始まった年
// period: 終わった年
// Type: ウイルス型と宿主
// Death toll: 死者数

var dataset = [
  { "name": "SARS", "time": 2002, "period": 2003, "Type": "Coronavirus / Bats Civets", "Death toll": "770"},
  { "name": "Ebola", "time": 2014, "period": 2016, "Type": "Ebolavirus / Wild animals", "Death toll": "11,000"},
  { "name": "MERS", "time": 2015, "period": "Present", "Type": "Coronavirus / Bats, camels", "Death toll": "850"},
  { "name": "COVID-19", "time": 2019, "period": "Present", "Type": "Coronavirus – Unknown (possibly pangolins)", "Death toll": "1M(2020.APL)"},
]
このオブジェクトデータを取り出して、表tableに出力していきます。
オブジェクト(JSON形式)に関しては、こちらの記事を参考ください。
オブジェクト操作
- ゴールイメージ
下記のような、<table>のHTML構造でデータ出力します。
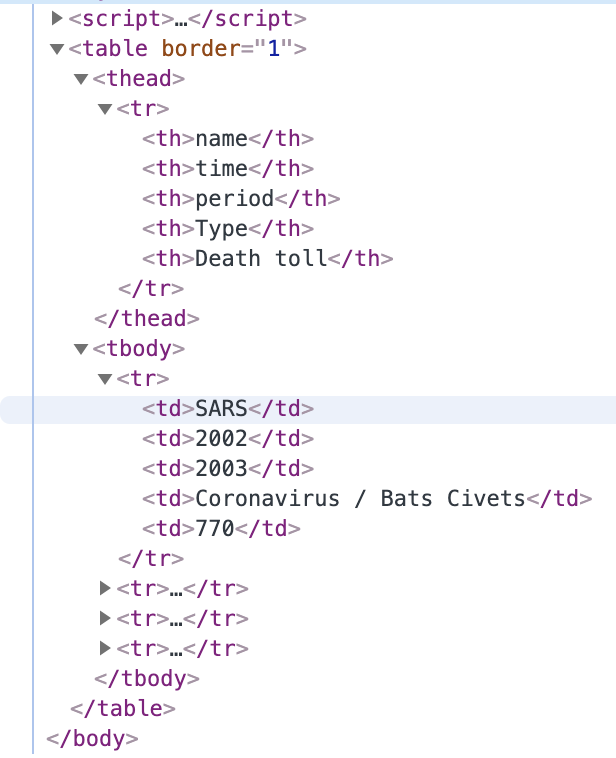
<th>見出し情報出力
下記のオブジェクトの見出し情報を取得して、<th>に出力していきます。
// name: 感染症の名前.data(names)“name” キーの情報を取得します。.append("th").text()<th>タグと見出しテキストを追加します。
table.append("thead")
  .append("tr")
  .selectAll("th")
  .data(names)
  .enter()
  .append("th")
  .text(function(d) { return d; });
<td>データ出力
下記のオブジェクトのデータ情報を取得して、<td>に出力していきます。
// time: 始まった年
// period: 終わった年
// Type: ウイルス型と宿主
// Death toll: 死者数keys()オブジェクトのキーを配列で取得します。d3.entrie()オブジェクトのキーと値を配列で取得します。
table.append("tbody")
  .selectAll("tr")
  .data(dataset)
  .enter()
  .append("tr")
  .selectAll("td")
  .data(function(row) { return d3.entries(row); }) // d3.entries オブジェクトのキーと値を配列取得
  .enter()
  .append("td")
  .text(function(d) { return d.value; }); //d.value 値の参照
CSSで表スタイルを整える
CSSを指定して、表を見やすくしています。
th,td {
    border: solid 1px;           /* 枠線指定 */
    border-color: #ccc;      /* 枠線色指定 */
    padding: 4px;         /* 余白指定 */
}

table {
    border-collapse:  collapse; /* セルの線を重ねる */
}

th {
    text-align: center;           /* 文字の揃え位置指定 */
    background: #eee;             /* 背景色指定 */
}

td {
    text-align:  left;        /* 文字の揃え位置指定 */
    min-width: 60px;      /* セルの最小横幅指定*/
}
まとめ
下記のような表tableを出力することができました。
以上、d3.jsでオブジェクトデータから、表tableを作成する方法でした。
関連情報
リンク
リンク
リンク