Matplotlib: グラフの描画
目次
Matplotlib(マットプロットリブ)とは?
Pythonと科学計算用ライブラリ。
NumPyのためのグラフ描画ライブラリ。
- オブジェクト指向のAPIを提供し、様々な種類のグラフを描画できる。
- 描画機能は主に2次元のプロットで、3次元プロットも追加傾向。
Matplotlibでできること – 公式ギャラリー
Matplotlibeでできることが公式ギャラリーで公開されています。
https://matplotlib.org/2.0.2/gallery.html
- Lines, bars, and markers
- Shapes and collections
- Statistical plots
- Images, contours, and fields
- Pie and polar charts
- Color
- Text, labels, and annotations
- Ticks and spines
- Axis scales
- Subplots, axes, and figures
- Style sheets
- Specialty plots
- Showcase
- API
- pylab examples
- mplot3d toolkit
- axes_grid toolkit
- widgets
- Miscellaneous examples
- Lines, bars, and markers
Matplotlibのインストール方法
pipコマンドを利用して、Matplotlibのインストールします。
pip install matplotlibpipとは?
Pythonの標準的なパッケージインストーラーであるpipコマンド
Mptplotlibのサンプルコード
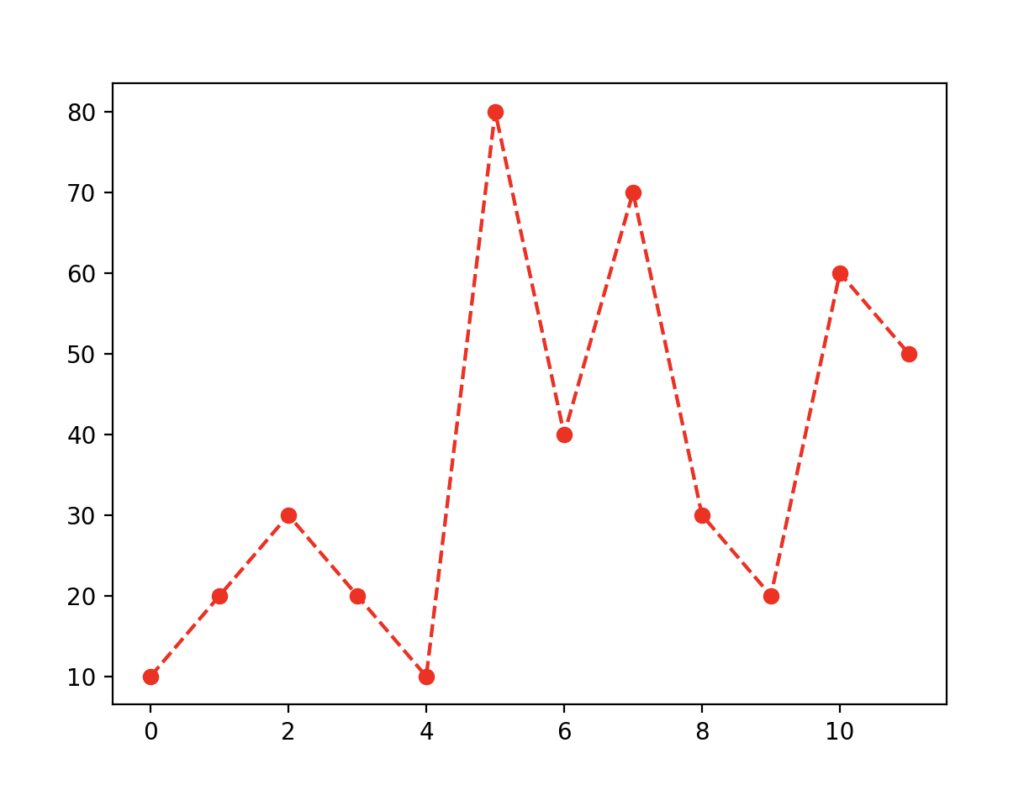
折れ線グラフを描画してみます。
結果
pythonコード
# =====================
# Mptplotlibのテスト
# =====================

# Mptplotlibライブラリのインポート
import matplotlib.pyplot as plt

# データの値
data = [10, 20, 30, 20, 10, 80, 40, 70, 30, 20, 60, 50]

# グラフのプロットと描画
plt.plot(data, 'o--r')
plt.show()
Python実行
ターミナルから以下のコマンドで、pythonコードを実行します。
python3 [Pythonファイル名].pyMatplotlibの簡単な使い方の手順
- matplotlib.pyplotをインポート
- データの配列を作成
- plot関数でプロット
- show関数でプロットしたグラフを描画
plot()関数
| 第一引数 | x軸の価 |
| 第二引数 | y軸の値 |
| 第三引数 | fmt引数:グラフのスタイル変更可能。 |
plot()公式リファレンス
- marker: グラフのスタイル指定
https://matplotlib.org/stable/api/markers_api.html - Color: 色変更も可能
https://matplotlib.org/2.0.2/users/colors.html
あわせて読みたい本
リンク
リンク
リンク