classを追加して、CSSでスタイルを指定する方法についてご紹介します。
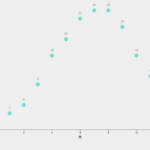
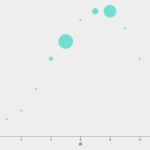
散布図の丸をCSSでスタイル変更してみます。
目次
HTML/JavaScriptサンプル
```
<!DOCTYPE html>
<html>
<head>
<meta charset="utf-8">
<style>
svg{
  font: 10px sans-serif;
  background-color: #eee;
  text-align: right;
  padding: 3px;
  margin: 1px;
  color: #333;
}

.cirStyle{
  r: 10;
  fill: #BF5E5E;
  stroke-width: 3px;
  stroke: #73412F;
  opacity: 0.7;

}
</style>
<script src="d3.min.js"></script>
</head>
<body>
<script>
// 1. データの準備
var dataset = [
    [1, 4],
    [2, 6],
    [3, 11],
    [4, 18],
    [5, 22],
    [6, 27],
    [7, 29],
    [8, 29],
    [9, 25],
    [10, 18],
    [11, 13],
    [12, 7],
];

var width = 800; // グラフの横幅
var height = 600; // グラフの縦幅
var margin = { "top": 40, "bottom": 80, "right": 40, "left": 80 };

// SVGの設定
var svg = d3.select("body").append("svg").attr("width", width).attr("height", height);

// x,y軸スケールの設定
var xScale = d3.scaleLinear()
.domain([0, d3.max(dataset, function(d) { return d[0]; })])
.range([margin.left, width - margin.right]);

var yScale = d3.scaleLinear()
.domain([0, d3.max(dataset, function(d) { return d[1]; })])
.range([height - margin.bottom, margin.top]);

// 軸の表示
var axisx = d3.axisBottom(xScale).ticks(5);
var axisy = d3.axisLeft(yScale).ticks(5);

svg.append("g")
  .attr("transform", "translate(" + 0 + "," + (height - margin.bottom) + ")")
  .call(axisx)
  .append("text")
  .attr("fill", "black")
  .attr("x", (width - margin.left - margin.right) / 2 + margin.left)
  .attr("y", 35)
  .attr("text-anchor", "middle")
  .attr("font-size", "10pt")
  .attr("font-weight", "middle")
  .text("月");

svg.append("g")
  .attr("transform", "translate(" + margin.left + "," + 0 + ")")
  .call(axisy)
  .append("text")
  .attr("fill", "black")
  .attr("text-anchor", "middle")
  .attr("x", -(height - margin.top - margin.bottom) / 2 - margin.top)
  .attr("y", -35)
  .attr("transform", "rotate(-90)")
  .attr("font-weight", "middle")
  .attr("font-size", "10pt")
  .text("最高気温");

// ラインの表示
svg.append("g")
   .selectAll("circle")
   .data(dataset)
   .enter()
   .append("circle")
   .attr("cx", function(d) { return xScale(d[0]); })
   .attr("cy", function(d) { return yScale(d[1]); })
   .attr("r", 4)
   .attr("id", function(d, i) { return "id-" + i; })
   .classed("cirStyle",true);
</script>
</body>
</html>
CSSの設定方法
.class()を使ってクラスを追加していきます。
// ラインの表示
svg.append("g")
   .selectAll("circle")
   .data(dataset)
   .enter()
   .append("circle")
   .attr("cx", function(d) { return xScale(d[0]); })
   .attr("cy", function(d) { return yScale(d[1]); })
   .attr("r", 4)
   .attr("id", function(d, i) { return "id-" + i; })
.classed("cirStyle",true);| メソッド | 説明 |
.class("クラス名", 引数) | 指定したクラス名を操作 第2引数: tureでクラス追加 falseでクラス削除 |
今回指定したスタイルはこちらです。
.cirStyle{
  r: 10;  //半径サイズ(circleの独自属性)
  fill: #BF5E5E; // 塗り潰しの色
  stroke-width: 3px; // 線の太さ
  stroke: #73412F; // 線の色
  opacity: 0.7; // 透明度 0.0-1.0
}
まとめ
以上、d3.jsでCSSでスタイルを指定するサンプルでした。
関連情報
リンク
リンク
リンク