グラフにツールチップを追加する方法をご紹介します。
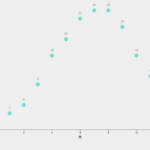
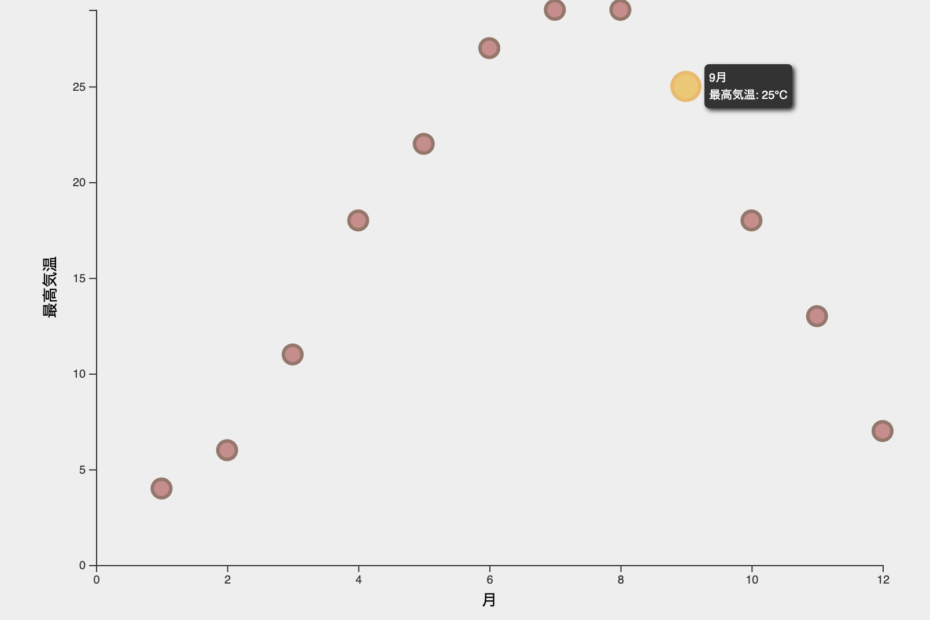
散布図の丸にCSSでツールチップを追加してみます。
目次
HTML/JavaScriptサンプル
<!DOCTYPE html>
<html>
<head>
<meta charset="utf-8">
<style>
svg{
  font: 10px sans-serif;
  background-color: #eee;
  text-align: right;
  padding: 3px;
  margin: 1px;
  color: #333;
}

.cirStyle {
  r: 8;
  fill: #BF5E5E;
  stroke-width: 3px;
  stroke: #73412F;
  opacity: 0.7;
}

.cirStyle:hover {
  r: 12;
  fill: #F2B705;
  stroke: #F29F05;
}

.tooltip {
  position: absolute;
  width: auto;
  height: auto;
  padding: 4px;
  font: 10px sans-serif;
  color: #fff;
  background: #333;
  -webkit-box-shadow: 2px 2px 4px rgba(0, 0, 0, 0.8);
  -moz-box-shadow: 2px 2px 4px rgba(0, 0, 0, 0.8);
  box-shadow: 2px 2px 4px rgba(0, 0, 0, 0.8);
  border-radius: 4px;
  visibility: hidden;
}

</style>
<script src="d3.min.js"></script>
</head>
<body>
<script>
// 1. データの準備
var dataset = [
    [1, 4],
    [2, 6],
    [3, 11],
    [4, 18],
    [5, 22],
    [6, 27],
    [7, 29],
    [8, 29],
    [9, 25],
    [10, 18],
    [11, 13],
    [12, 7],
];

var width = 800; // グラフの横幅
var height = 600; // グラフの縦幅
var margin = { "top": 40, "bottom": 80, "right": 40, "left": 80 };

// tooltip用div要素追加
var tooltip = d3.select("body").append("div").attr("class", "tooltip");

// SVGの設定
var svg = d3.select("body").append("svg").attr("width", width).attr("height", height);

// x,y軸スケールの設定
var xScale = d3.scaleLinear()
.domain([0, d3.max(dataset, function(d) { return d[0]; })])
.range([margin.left, width - margin.right]);

var yScale = d3.scaleLinear()
.domain([0, d3.max(dataset, function(d) { return d[1]; })])
.range([height - margin.bottom, margin.top]);

// 軸の表示
var axisx = d3.axisBottom(xScale).ticks(5);
var axisy = d3.axisLeft(yScale).ticks(5);

svg.append("g")
  .attr("transform", "translate(" + 0 + "," + (height - margin.bottom) + ")")
  .call(axisx)
  .append("text")
  .attr("fill", "black")
  .attr("x", (width - margin.left - margin.right) / 2 + margin.left)
  .attr("y", 35)
  .attr("text-anchor", "middle")
  .attr("font-size", "10pt")
  .attr("font-weight", "middle")
  .text("月");

svg.append("g")
  .attr("transform", "translate(" + margin.left + "," + 0 + ")")
  .call(axisy)
  .append("text")
  .attr("fill", "black")
  .attr("text-anchor", "middle")
  .attr("x", -(height - margin.top - margin.bottom) / 2 - margin.top)
  .attr("y", -35)
  .attr("transform", "rotate(-90)")
  .attr("font-weight", "middle")
  .attr("font-size", "10pt")
  .text("最高気温");

// ラインの表示
svg.append("g")
   .selectAll("circle")
   .data(dataset)
   .enter()
   .append("circle")
   .attr("cx", function(d) { return xScale(d[0]); })
   .attr("cy", function(d) { return yScale(d[1]); })
   .attr("r", 4)
   .attr("id", function(d, i) { return "id-" + i; })
   .classed("cirStyle",true)
   // タッチイベント設定
   .on("mouseover", function(d) {
     tooltip
     .style("visibility", "visible")
     .html(d[0] + "月" + "<br>最高気温: " + d[1] + "℃");
   })
   .on("mousemove", function(d) {
     tooltip
     .style("top", (d3.event.pageY - 20) + "px")
     .style("left", (d3.event.pageX + 10) + "px");
   })
   .on("mouseout", function(d) {
     tooltip.style("visibility", "hidden");
    })
</script>
</body>
</html>
CSSの設定方法
ツールチップのスタイルをCSSのクラス名で指定しておきます。
visibility: hidden; を指定し最初は見えないようにしておきます。
.tooltip {
  position: absolute;
  width: auto;
  height: auto;
  padding: 4px;
  font: 10px sans-serif;
  color: #fff;
  background: #333;
  -webkit-box-shadow: 2px 2px 4px rgba(0, 0, 0, 0.8);
  -moz-box-shadow: 2px 2px 4px rgba(0, 0, 0, 0.8);
  box-shadow: 2px 2px 4px rgba(0, 0, 0, 0.8);
  border-radius: 4px;
  visibility: hidden;
}
JavaScriptの設定
ツールチップ用の要素を追加しておきます。
// ツールチップ用div要素追加
var tooltip = d3.select("body").append("div").attr("class", "tooltip");
サークルを表示する際にタップイベントとツールチップの表示を設定しておきます。
// サークルの表示
svg.append("g")
   .selectAll("circle")
   .data(dataset)
   .enter()
   .append("circle")
   .attr("cx", function(d) { return xScale(d[0]); })
   .attr("cy", function(d) { return yScale(d[1]); })
   .attr("r", 4)
   .attr("id", function(d, i) { return "id-" + i; })
   .classed("cirStyle",true)
   // タッチイベント設定
   .on("mouseover", function(d) {
     tooltip
     .style("visibility", "visible")
     .html(d[0] + "月" + "<br>最高気温: " + d[1] + "℃");
   })
   .on("mousemove", function(d) {
     tooltip
     .style("top", (d3.event.pageY - 20) + "px")
     .style("left", (d3.event.pageX + 10) + "px");
   })
   .on("mouseout", function(d) {
     tooltip.style("visibility", "hidden");
})タッチイベントのハンドリング
on(eventType, listener)
eventTypeのイベント発生したら, listenerを実施。
.on()イベントタイプ
| mousedown | マウスボタンがクリックされた |
| mouseup | マウスボタンが離れた |
| mouseover | マウスオーバーされた |
| mouseout | マウスオーバーが外れた |
| touchstart | タッチが開始された |
| touchend | タッチが終了した |
| click | クリックされた |
まとめ
以上、d3.jsでCSSでスタイルを指定するサンプルでした。
関連情報
リンク
リンク
リンク